 |
|
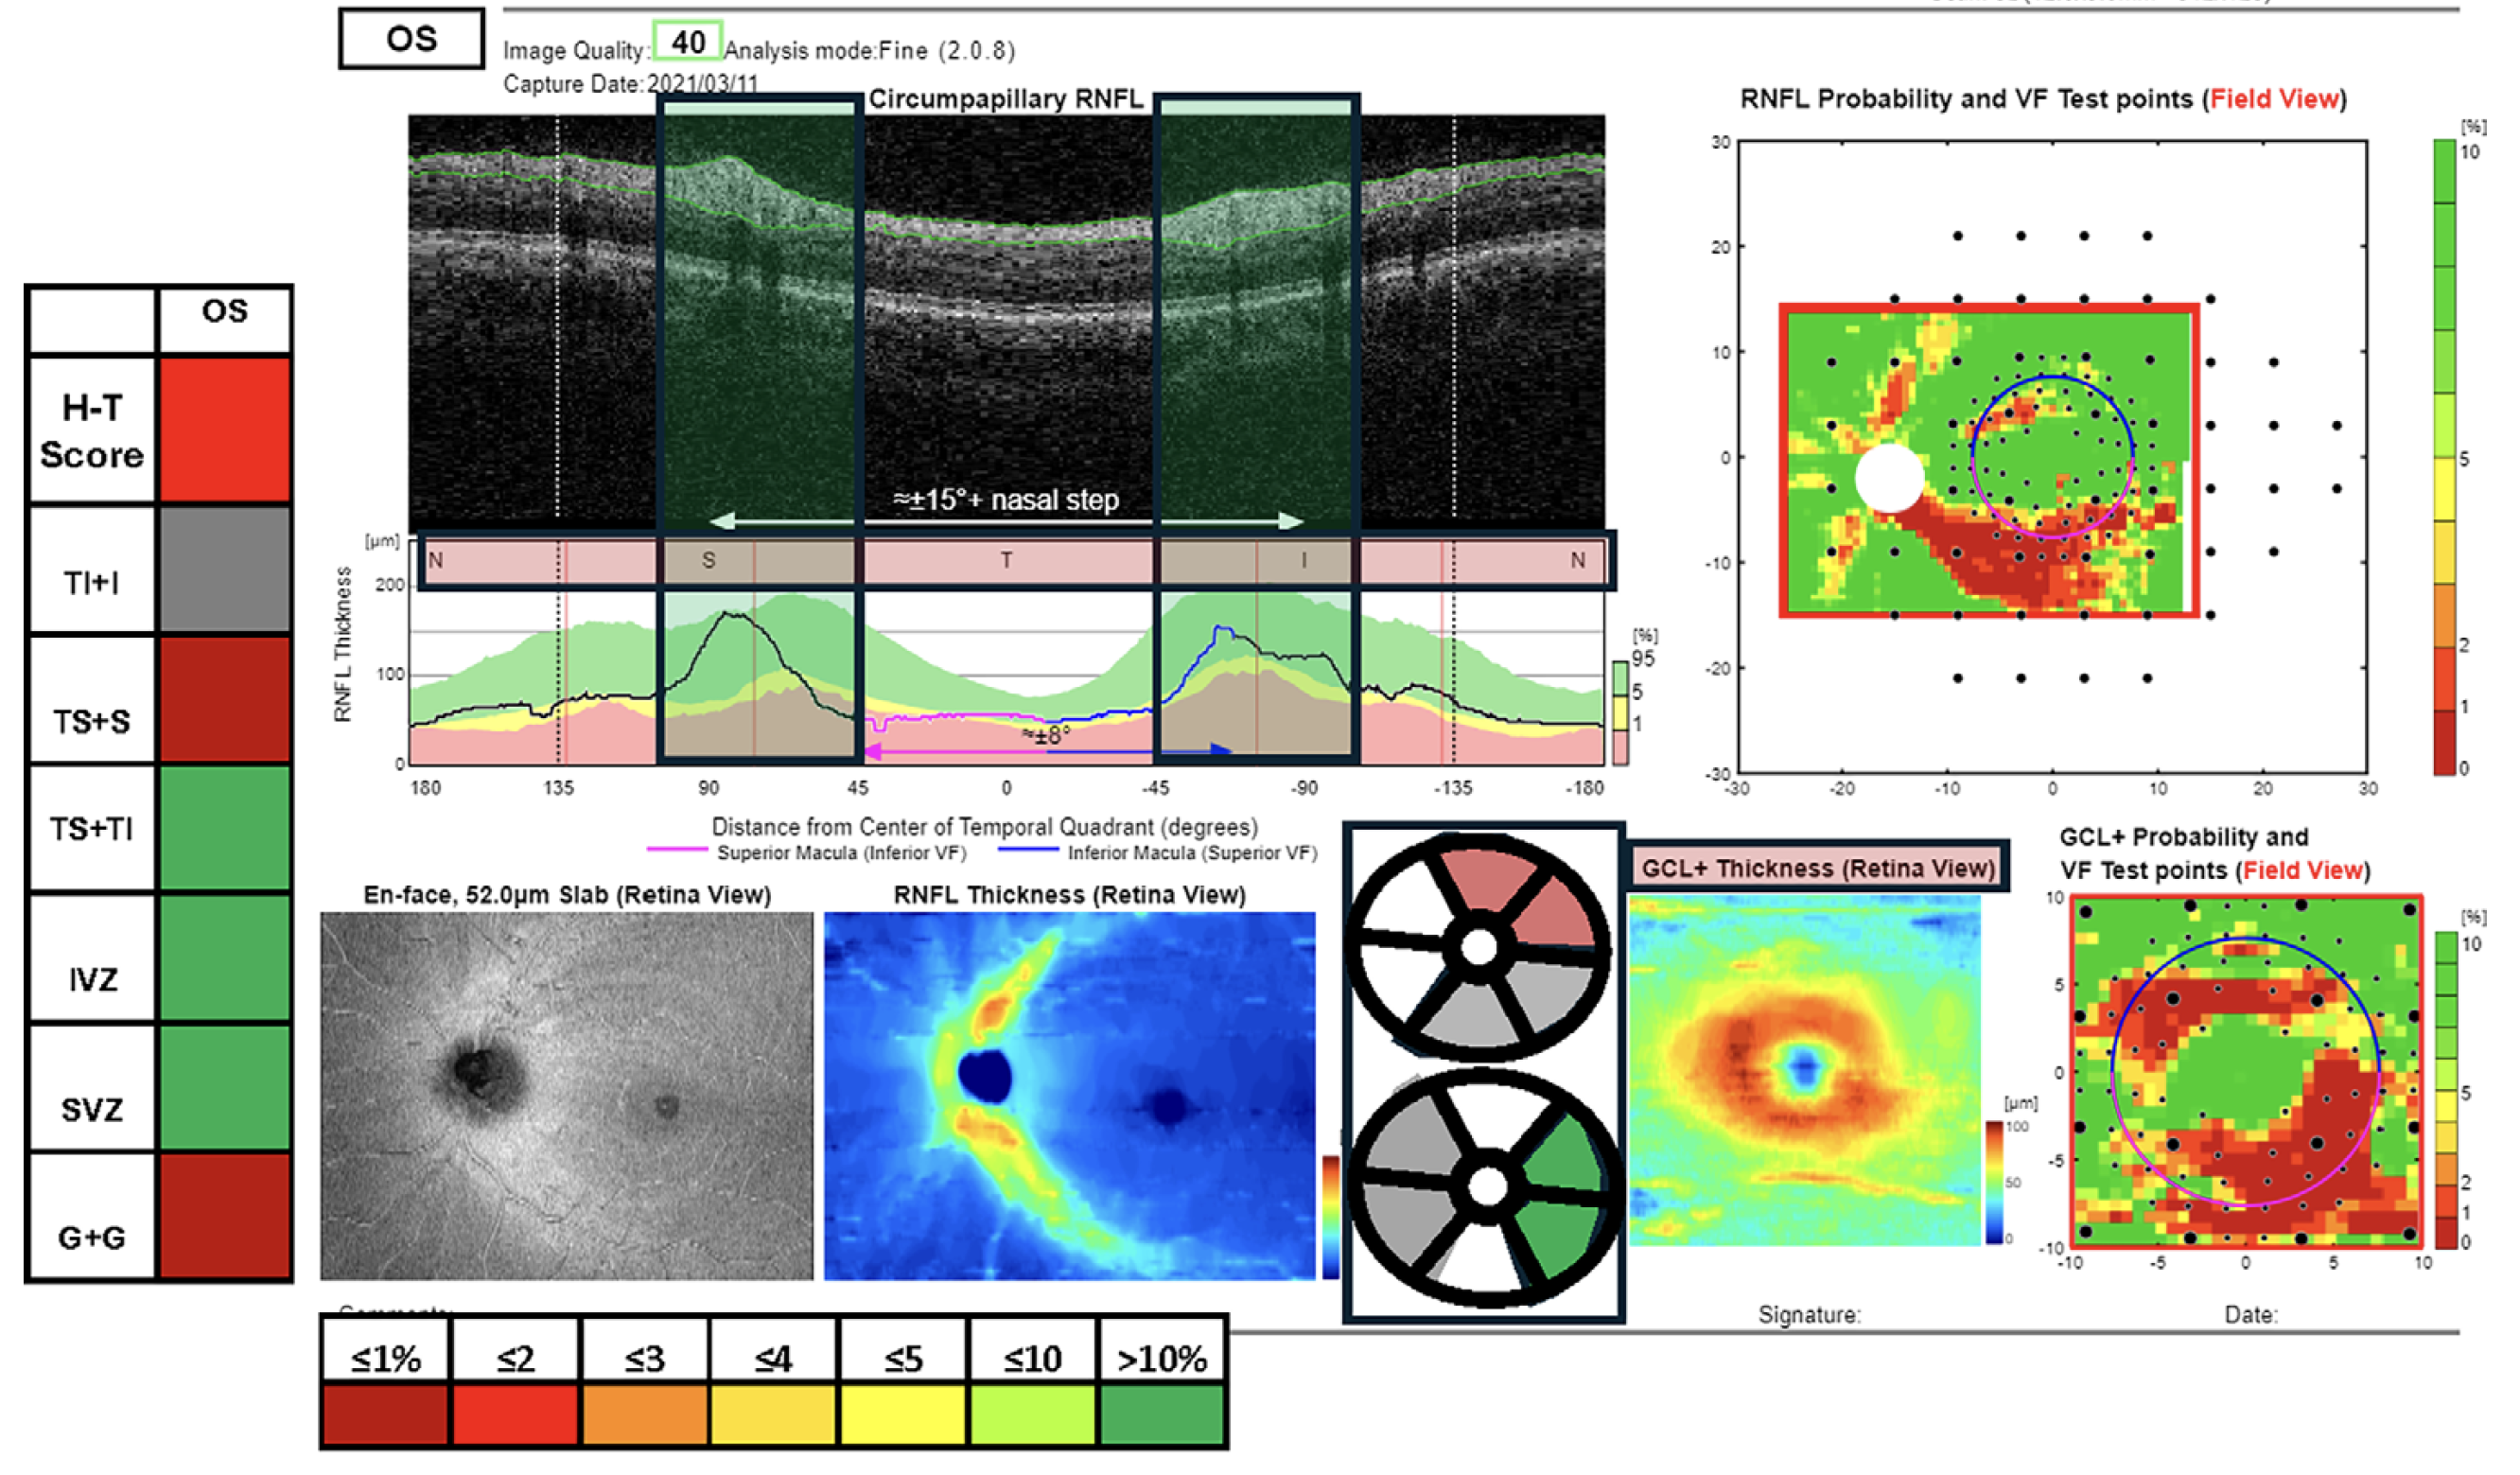
The H-T score was developed based on six individual variables of cpRNFL and GCL+IPL regional thickness, which were combined into a single metric with logistic regression analysis. In time, commercial release of this metric may allow the popular Hood Report to gain additional precision. This image from the study shows a modified version of the Hood Report that includes the percentile based on a real-world reference database of each of the six variables in the H-T model. Photo: Hood DC, et al. Transl Vis Sci Technol. 2024 Dec 2;13(12):21. Click image to enlarge. |
OCT has become invaluable to clinicians in monitoring for glaucomatous structural damage involving the optic nerve, peripapillary RNFL and macula. Doing so, they can correlate those changes to functional vision loss. However, there is disagreement on how best to interpret OCT results. Clinical trials and risk calculators often depend upon a strictly quantitative approach that is often based on conventional metrics from commercial OCT devices. In a 2022 paper, researchers in Japan developed a multivariable logistic regression model that reduced the number of OCT variables in a model down to six.
A recent paper published in Translational Vision Science & Technology modified the model’s six variables to be based on characteristic patterns of damage seen on the OCT thickness maps of the ganglion cell layer plus inner plexiform layer (GCL+IPL) and retinal nerve fiber layer (RNFL). Testing their model and the original with two cohorts of data chosen to assure a wide range of glaucomatous damage, the research team determined that their updated model outperformed other OCT metrics for detecting glaucomatous damage, with a sensitivity at 95% and specificity at 88.8%.
A team led by Donald C. Hood, PhD, at Columbia University Irving Medical Center in New York City used two cohorts to develop the logistic regression model. The healthy cohort consisted of 400 individuals randomly selected from a real-world reference database of OCT widefield scans (Maestro2, Topcon) from 4,932 eyes/individuals obtained from 10 optometry practices. The glaucoma cohort consisted of 207 individuals from the same 10 practices but with OCT reports with evidence of optic neuropathy consistent with glaucoma. The team called the metric they devised the H-T score.
The area under the curve (a measure of predictive ability) for specificity of >90% was 0.92, and the sensitivity at 95% specificity was 88.8%. These values were significantly greater than those of a previously reported model’s metric (0.82 and 78.1%, respectively) and two common OCT thickness metrics: global circumpapillary RNFL (0.77 and 57.5%, respectively) and global GCL+IPL (0.72 and 47.6%, respectively).
“A specificity of 95% may be too low for some screening purposes,” the researchers noted in their paper. “However, we have recently identified anatomical factors, such as fovea-to-disc distance and location of peak thickness of the circumpapillary RNFL profile, that affect specificity and are exploring ways to use this information to de facto improve specificity for a given sensitivity.”
Still, they warned that these scores should not be taken as a measure of the probability of having or developing glaucoma unless specifically validated for this purpose. Instead, for the time being, the model provides a link between single metrics such as the H-T score and the subjective evaluation of elements (e.g., RNFL and GCL+IPL thickness maps) of the commercial Hood Report.
The authors contend that the new metric, though not yet ready for clinical deployment, has the potential to improve the accuracy of referrals from primary care to specialist care via risk scores and calculators, as well as glaucoma definitions for clinical trials. “In addition, a report that combines the H-T score with information about the percentile of the individual parameters may improve the clinician's use of the OCT for diagnosing glaucoma,” the study concluded.
| Click here for journal source. |
Hood DC, La Bruna S, Durbin M, et al. A pattern-based OCT metric for glaucoma detection. Transl Vis Sci Technol. 2024 Dec 2;13(12):21. |
